Performance
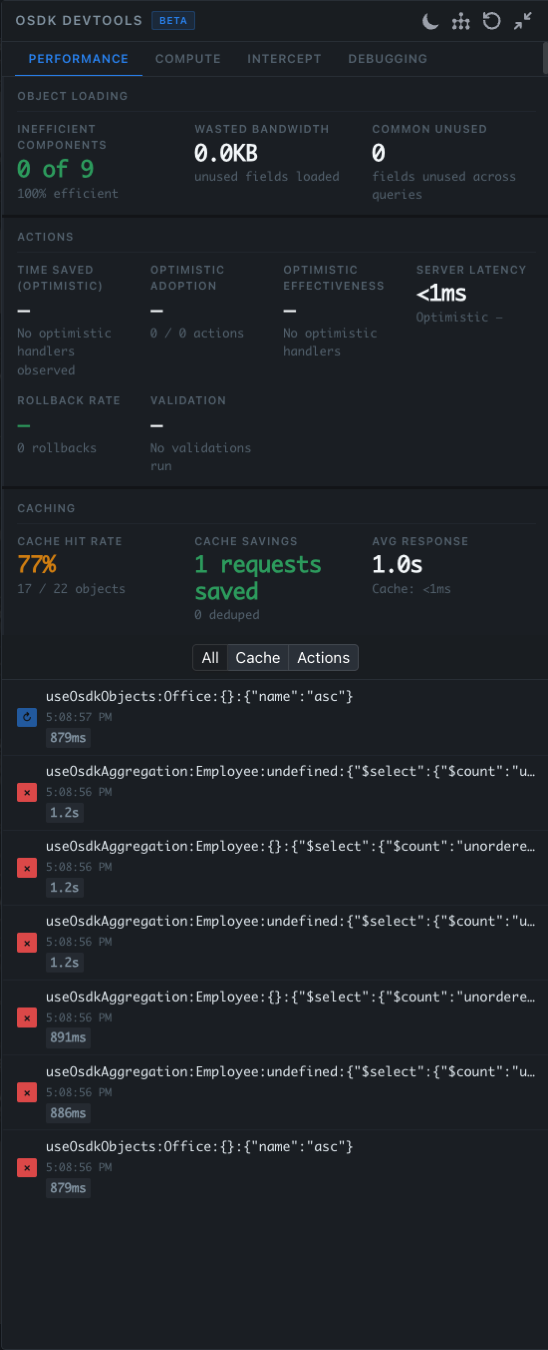
The Performance tab surfaces live metrics for how @osdk/react is fetching, caching, and revalidating data — so you can spot slow queries, redundant work, and over-fetched fields before they ship.
Prerequisites
Before reading this page, complete the setup described in the Prerequisites and skim Getting Started for the panel basics.
Sections at a glance
The Performance tab is split into three sections, each summarizing one aspect of how your app is using @osdk/react.
Object Loading
| Metric | Description |
|---|---|
| Inefficient Components | Components whose hook selects fetch fields that no descendant ever reads. Displayed as N of M along with an efficiency percentage. |
| Wasted Bandwidth | Total bytes pulled for fields that were fetched but never read by any component. |
| Common Unused | Fields that are unused across multiple queries — strong candidates for trimming from the SDK select. |
A reading of 0 of 9 — 100% efficient means every component is reading every field its hooks asked for. Anything less is fetching fields that nobody renders.
Actions
| Metric | Description |
|---|---|
| Time Saved (Optimistic) | Wall-clock latency the user did not have to wait for, thanks to optimistic handlers on useOsdkAction. |
| Optimistic Adoption | How many actions in the session ran with an optimistic handler vs. without (X / Y actions). |
| Optimistic Effectiveness | Of the optimistic actions, what share predicted the server response correctly (so no rollback was required). |
| Server Latency | Median server-side latency for action submission, with the optimistic comparison alongside. |
| Rollback Rate | How often the optimistic prediction had to be reverted because the server disagreed. |
| Validation | Action-validation runs observed. Useful when wiring up validators to confirm they are actually firing. |
When no optimistic handlers are in use, the optimistic columns read "No optimistic handlers observed" — that's a hint that adding handlers would likely improve perceived latency.
Caching
| Metric | Description |
|---|---|
| Cache Hit Rate | Percentage of reads served from the normalized cache, e.g. 77% — 17 / 22 objects. |
| Cache Savings | Network requests that were avoided because the result was already cached, plus dedupe-driven savings. |
| Avg Response | Average response time. Splits cache reads (typically <1ms) from network reads. |
Request list
Below the section cards is a feed of every request the cache issued during the session. The header has three filters:
- All — every request, in chronological order
- Cache — reads (e.g.
useOsdkObjects:Office:{}:{"name":"asc"}) - Actions —
useOsdkActionand other mutation traffic
Each entry shows:
- The hook signature and parameters that originated it
- A timestamp
- A duration badge (e.g.
879ms,1.2s) - A status icon — cached, network, error, etc.
Click into a row to see the full hook arguments, the component subtree that owns it, and any peers that were deduplicated onto the same request.
When to use it
Reach for the Performance tab when:
- A screen feels slow and you want to know if the bottleneck is network, cache, or render
- You suspect duplicate requests are being made for the same object set
- You are tuning queries and want to confirm dedupe and revalidation are doing what you expect
- You want to trim over-fetched fields out of a query before merging it
Reading slow queries
Sort by duration to find the worst offenders. If a slow load is also serving multiple components via deduplication, that's expected and good. If it is unique to one component and feels too slow, the hook configuration (selected fields, filters, page size) is the first place to look.
Spotting redundant work
Two patterns are common:
- Two components reading the same data with slightly different selects. Both queries fetch the same objects, but neither hits the cache for the other. Align the selects so they dedupe.
- A revalidation fires immediately after a fresh fetch. Usually caused by an unnecessary
invalidate()call or by an action whosedependsOnis broader than necessary.
Both show up in the request list and in the Cache Savings card.
Trimming unused fields
Any field selected by a hook but never read by a component is flagged in Wasted Bandwidth and rolled up into Inefficient Components. Removing unused fields:
- Shrinks the wire payload
- Reduces cache churn (fewer fields revalidated)
- Often unlocks tighter dedupe with sibling components
The flag is conservative — a field has to be fetched and not read across the lifetime of the panel session before it counts.
Tips
- Open the panel before navigating to the screen you want to measure. Loads that completed before the panel mounted are not retroactively annotated.
- Pair this tab with the Debugging cache inspector when chasing why a particular query is missing the cache.
- Combine with the Compute tab when you also want backend cost attribution, not just client latency.