Compute
The Compute tab tracks per-request Foundry compute usage and response sizes in real time, attributed back to the network calls @osdk/react is making on your behalf.
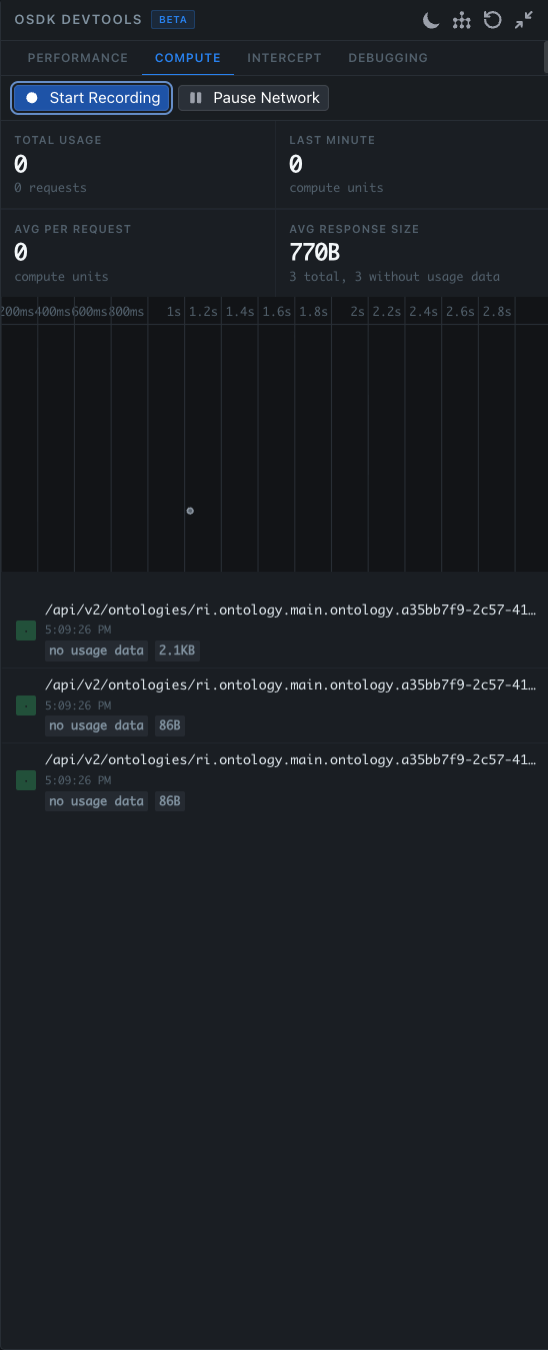
Compute attribution is only supported for certain backend APIs at the moment. Requests whose backends do not yet emit compute metadata are shown with a no usage data badge — they're still listed for size and timing, but they do not contribute to the compute totals.
Prerequisites
Before reading this page, complete the setup described in the Prerequisites.
Controls
At the top of the tab:
- Start Recording — begin collecting compute and response data. Recording is off by default so the panel does not retain a full session by accident.
- Pause Network — freeze the application against the current cache state. While paused, hooks continue rendering from the cache but no new requests are issued. The button label flips to Resume while paused — click it again to unfreeze.
Summary cards
| Metric | Description |
|---|---|
| Total Usage | Total compute units consumed since recording started, with the count of requests that produced compute data. |
| Last Minute | Rolling one-minute window of compute units. Useful for spotting bursts. |
| Avg Per Request | Average compute units per request that emitted usage data. |
| Avg Response Size | Average response payload size, with the total count of recorded responses and how many lacked usage data (e.g. 3 total, 3 without usage data). |
Timeline
A horizontal time axis (200ms, 400ms, … 2.8s) plots each request by its response time. Hovering a point reveals the originating hook and component, the response size, and the compute units (when available). Use it to spot outliers at a glance.
Request list
Below the timeline is the list of individual requests, each labelled with:
- The Foundry endpoint that was hit, e.g.
/api/v2/ontologies/ri.ontology.main.ontology.… - A timestamp
- A
no usage databadge for backends that do not yet emit compute metadata, or the compute units consumed when available - A size badge (
2.1KB,86B, etc.)
Click a row to see the request and response shape, the hook that triggered it, and the cache entries it wrote.
When to use it
Reach for the Compute tab when:
- You're profiling a screen and need to know which requests are most expensive on the backend, not just on the client
- You want to compare the compute cost of two implementations of the same screen
- You suspect a single hook is responsible for a disproportionate share of compute usage
- You want to demonstrate the live cache to a teammate without firing new requests
Pausing network traffic
The Pause Network control freezes the live cache state. While paused, the button reads Resume — click it again to unfreeze. While paused:
- All
@osdk/reacthooks continue to render against the cache - New requests that would normally be issued are suppressed
- Invalidations are queued and applied when you resume
This is useful for inspecting the live state of the cache without it shifting under you, and for capturing repeatable scenarios for the Intercept tab.
Tips
- Hit Start Recording right before the action you want to measure, so the totals reflect a single user flow rather than an entire session.
- If a request shows
no usage databut you know it's doing work, the underlying backend API does not yet emit compute metadata — fall back to the Performance tab for client-side latency. - The timeline only plots requests that actually completed during the recording window. Long-running requests started before recording began will not appear.