Debugging
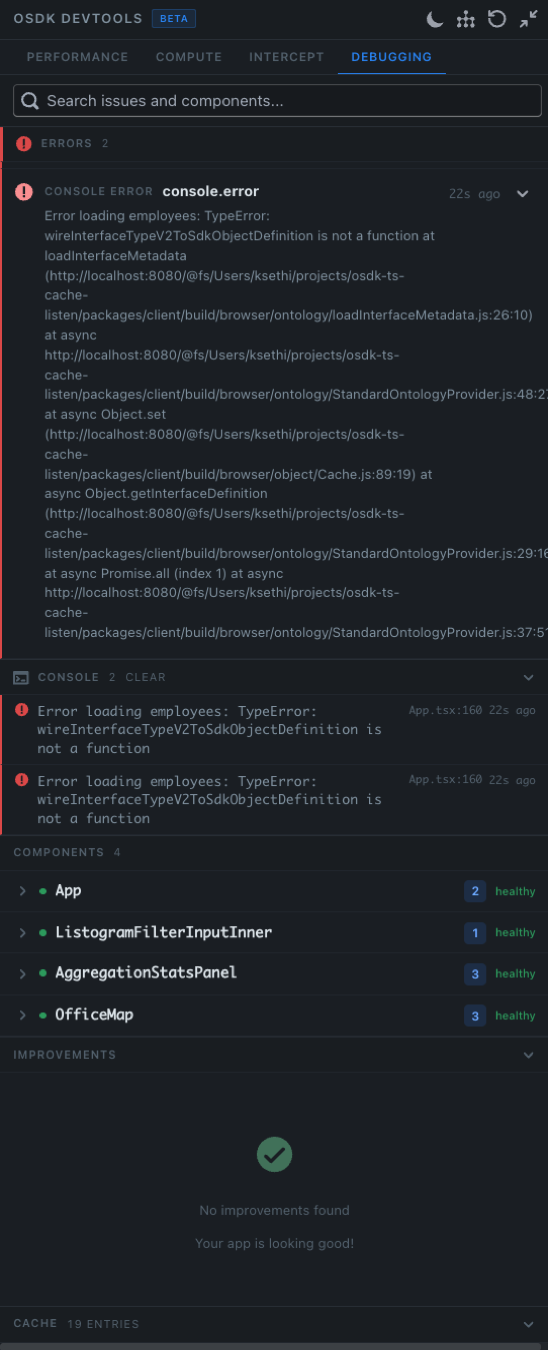
The Debugging tab is a unified surface for the day-to-day questions that come up while building an OSDK React app — why did this throw?, what hooks is this component using?, and what does the cache actually contain?
Prerequisites
Before reading this page, complete the setup described in the Prerequisites.
Search
A search bar at the top of the tab — "Search issues and components…" — filters every section below by free-text query. Useful for jumping straight to a specific error message, hook name, or component.
Errors
Uncaught errors thrown from @osdk/react hooks or from your render tree appear here, each with:
- A category tag (e.g.
CONSOLE ERROR) - The full stack trace, including the file paths inside
node_modulesand your own source so you can click through - A relative timestamp (e.g. 22s ago)
- An expand chevron to show the parameters that were passed to the hook when it threw
The counter in the section header (ERRORS 2) tracks the unread count for the session.
Console
A clean feed of every console.log, console.warn, and console.error captured during the session, deduped against the Errors panel so a single thrown error shows up in both views without double-counting. Each row links to the originating source location (e.g. App.tsx:160).
A CLEAR button in the header empties the feed without affecting the Errors panel above.
Components
A list of every component currently mounting an @osdk/react hook. For each component the row shows:
- The component name (e.g.
App,ListogramFilterInputInner,AggregationStatsPanel,OfficeMap) - The number of active hooks bound to it
- A health badge — healthy when none of its hooks are erroring, otherwise unhealthy with a count of failing hooks
Expanding a row reveals the individual hook signatures, their current state (loading, ready, error), and whether they are reading from cache or have an outstanding request. Use it to answer questions like "which component is causing this query?" and "how many components are subscribed to this object set?".
Improvements
A heuristic-driven panel that surfaces concrete recommendations — unused selects to trim, hooks that could be optimistic, queries that could dedupe. When everything is in order the panel reads "No improvements found — Your app is looking good!".
This is a strict subset of what the Performance tab surfaces; Improvements is the here is what to do about it view, while Performance is the here is what is happening view.
Cache inspector
At the bottom of the tab is a collapsible CACHE entry list showing the live state of the normalized @osdk/react cache:
- Objects — every cached object, by type and primary key
- Lists — every cached object set, by hook signature
- Links — cached link traversals (e.g.,
Employee → lead) - Aggregations — cached aggregation results
The header tracks the total entry count (e.g. CACHE 19 ENTRIES). Expand to browse; expand a row to see the underlying value, the timestamp it was written, and the hooks subscribed to it.
When to use it
Reach for the Debugging tab when:
- A hook is throwing and you want the parameter details, not just a stack trace
- You want to confirm that a stale-looking screen really is reading the latest cache state
- You're chasing a "ghost" subscription — a component still holding a hook open after navigation
- You need to verify an invalidation actually evicted the entries you expected
Tips
- The Errors and Console panels survive navigation within the same dev session, so errors that fire briefly during a route transition do not get lost.
- Use the Errors panel together with the Intercept tab to reproduce an error deterministically: capture the offending component, swap its response to Error/Failure, and watch the same error fire on demand.
- The cache inspector is read-only. To mutate cache contents, use an action through
useOsdkAction(which the devtools observe automatically) or use the Intercept tab for ad-hoc overrides.
Related
- Performance — measures how the cache is being filled
- Compute — measures what it cost on the backend
- Intercept — overrides the cache to reproduce or prototype state