Overview
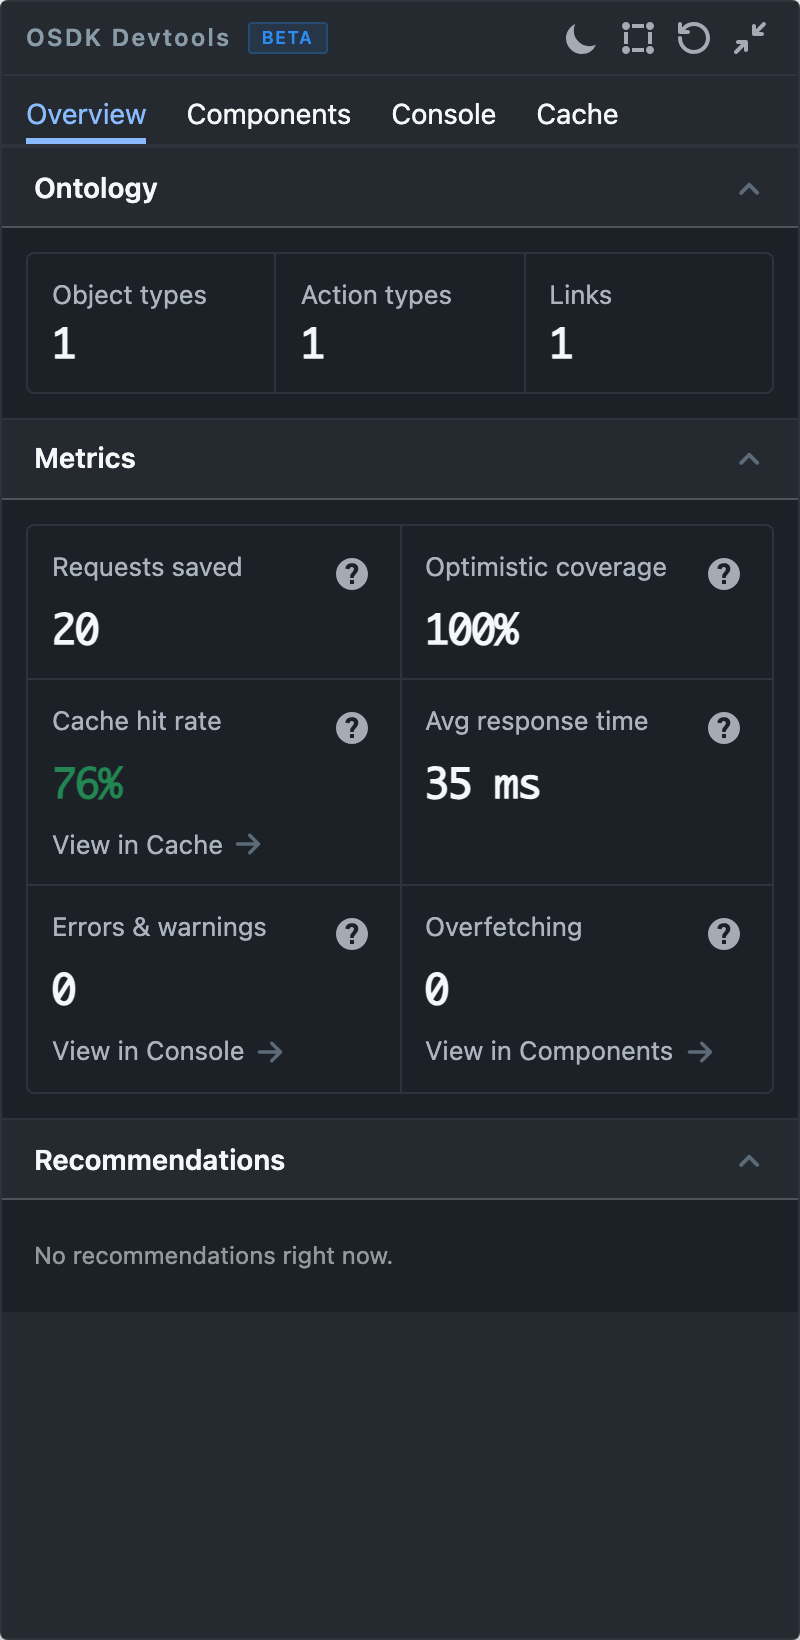
Overview is the default tab. It summarizes how the mounted React tree uses the Ontology and how the observable client has behaved during the current browser session.
Ontology
The Ontology section counts the distinct object types, action types, and links used by mounted components. A zero count means the monitor has not detected that kind of usage yet.
Metrics
- Requests saved counts cache hits, revalidations, and deduplicated requests that avoided another network call.
- Optimistic coverage measures the share of observed actions that updated the UI before the server response arrived.
- Cache hit rate measures the share of object reads that the client served from cache or revalidation. The panel waits for enough reads before showing a percentage. Open Cache to inspect the entries and operations behind the rate.
- Avg response time combines cache and network reads for the current session.
- Errors & warnings counts captured
console.warnandconsole.errorentries. Open Console to inspect them. - Overfetching counts analyzed component queries whose descendants read less than 70% of the fetched fields.
The cache hit rate, error count, and overfetching count use color to call attention to poor states. The metric help controls explain each threshold.
Recommendations
Recommendations turn the collected metrics and component observations into specific fixes. A recommendation can include a copyable prompt for the relevant query or component. When the monitor has no recommendation, this section reads No recommendations right now.
Session behavior
Reset metrics from the panel header before reproducing a specific flow. The reset clears collected metrics without modifying application data or the observable cache.