Console
Console captures browser console output while the monitor is active and keeps it available as you navigate within the application.
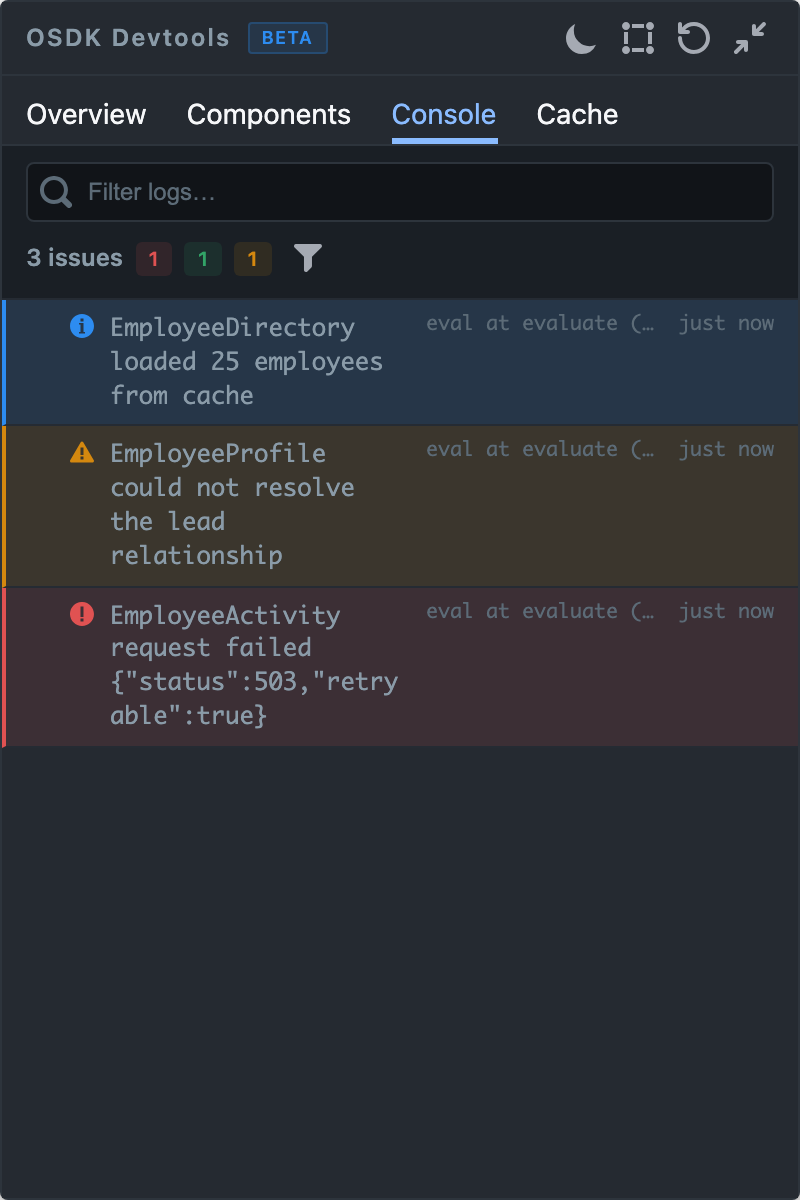
Search and filter
The search field filters serialized log arguments. The filter menu selects all, log, info, warn, error, or debug entries. It also contains Clear logs, which empties the captured feed without resetting the other Devtools metrics.
The toolbar shows the total issue count and separate counts for errors, other logs, and warnings. When a search or level filter hides entries, the toolbar reports how many are hidden.
Log entries
Each entry shows its level, timestamp, serialized arguments, and source location when the browser exposes one. The monitor limits serialization depth and size for objects and errors so a large payload cannot take over the panel.
The feed renders the 200 most recent matching entries. The store keeps up to 1,000 captured entries. Narrowing the search or level filter can bring an earlier matching entry back into the rendered list.
When to use it
Use Console to keep brief warnings visible across navigation, correlate an Overview error count with its original message, or filter noisy application output to a single object type or action.